Whitepaper
The Cyclicality of Manager Alpha
By Stan Miranda
2 February 2018
2016 represented a year by which active investors had crowded into virtually every corner of the investment world, exhausting any remaining pockets of inefficiency and saw more managers under-performing their benchmarks than we can recall in our 16 year history. As expected, we saw a capitulation by many capital owners who moved more of their capital from active to passive managers. You may recall we devoted significant intellectual resource in 2016 to dig into the drivers of the disappearance of alpha and presented our conclusions to an assembled audience of over 100 of our clients in London in October 2016. Our conclusions were the following:
There will always remain a small minority of managers capable of persistently generating out-performance over the long term, with the greatest opportunities in strategies where the managers: 1) add value to the assets they manage, 2) are early investors in new emerging investment sectors and 3) bring a distinct skill or cost advantage to a specific investment arena. However, the magnitude of such alpha will vary over time as investors overcrowd certain areas of opportunity or inefficiency, seeing levels of alpha fall and eventually leave that investment space. It then follows that the inefficiency returns for those who never left or who can time their re-entry in line with the alpha cycles. Over the long term, we believe in a state of equilibrium market efficiency where markets are both inefficient enough for active investors to be compensated for their costs, but efficient enough to discourage additional active investors.
This cyclical behaviour of alpha is captured in the following chart (Exhibit 1) which shows the percentage of active equity managers outperforming their benchmarks on a rolling 5-year basis. You can see there have been periods of fairly violent swings in under and out-performance by active equity managers. The chart also shows that 2017 was a better year for active management, something we witnessed across our client portfolios. In 2016, just over 50% of the active managers in the Partners Capital Master Portfolio C beat their benchmarks, resulting in negligible manager alpha for the year. By contrast, 2017 saw 67% of managers outperforming their benchmarks registering more than 2% manager alpha, in line with our long-term expectations for out-performance.
Exhibit 1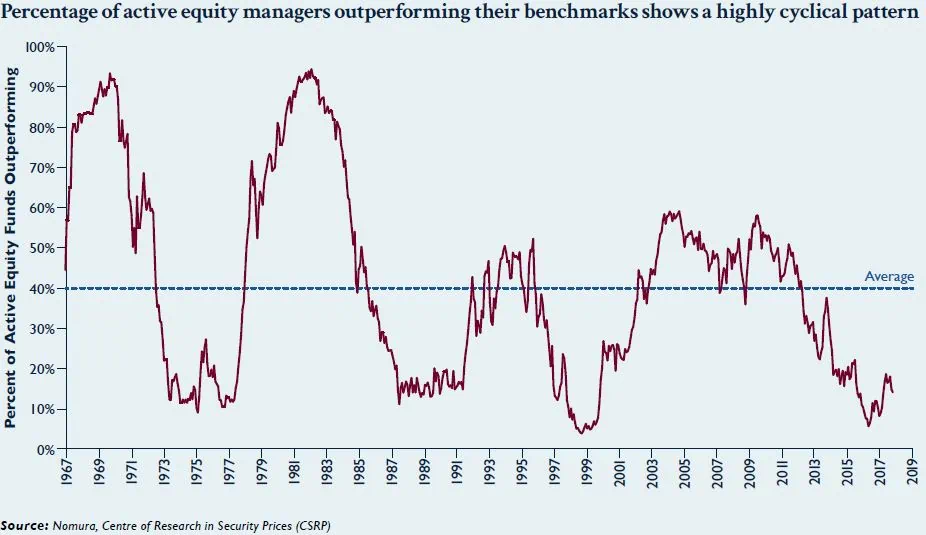
Looking ahead, the question is whether 2017 represented the start of a cyclical upturn in manager alpha expectations. To answer this, we have re-examined the environmental factors that lead to stronger alpha generation. Our research shows there are five such factors (‘moving parts’) that result in greater dispersion as well as volatility, thereby creating an environment in which active management thrives. The moving parts or factors most closely associated with manager alpha include the following:
- Return to conventional monetary policy (e.g., tapering of quantitative easing)
- Steady rise in interest rates
- Steepening yield curve
- Large fund flow movement (whether in or out of active risk markets)
- Absence of major market reversals or shocks (these tend to interrupt the natural alpha cycle driven by the factors above)
Based on our analysis, we think 2018 should be a good year for alpha generation as four out of the five factors are directionally aligned. While there are geopolitical risks on the horizon which could effectively swamp these factors, on balance we are quite optimistic about active management in 2018. Within strategies, we are focusing on those looking to exploit higher stock dispersion (equity long short, equity market neutral) as well as those looking to benefit from diverging central bank policies and rising interest rates. We believe that our roster of high quality managers across asset classes should be well positioned to use the environment to good effect and deliver strong out-performance for our clients.
Over the long-term, hedge fund strategies such as equity long short, equity market neutral and macro strategies have undergone periods of out and under-performance versus their respective benchmarks, as shown in Exhibit 2.
Exhibit 2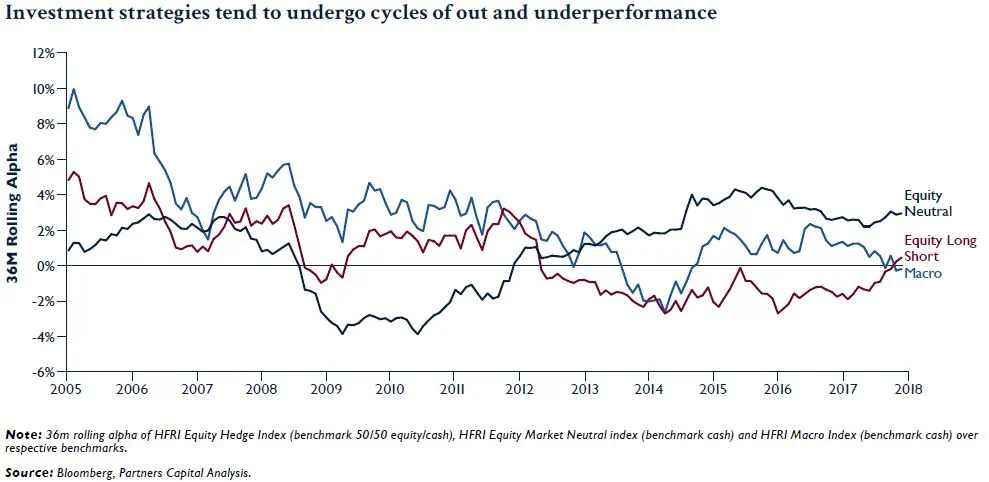
This long term trend is also visible when looking at the percentage of managers outperforming their benchmarks, a metric we feel is more important than the average level of out-performance for any given strategy. Exhibit 3 below shows the percentage of mutual funds that have outperformed since 2005 on a 1-year and 3-year basis (in contrast to Exhibit 1, which shows rolling 5-years out-performance). There is significant variability in the proportion of alpha generating managers over the years, with H1 2017 marking a recovery after a number of below par years.
Exhibit 3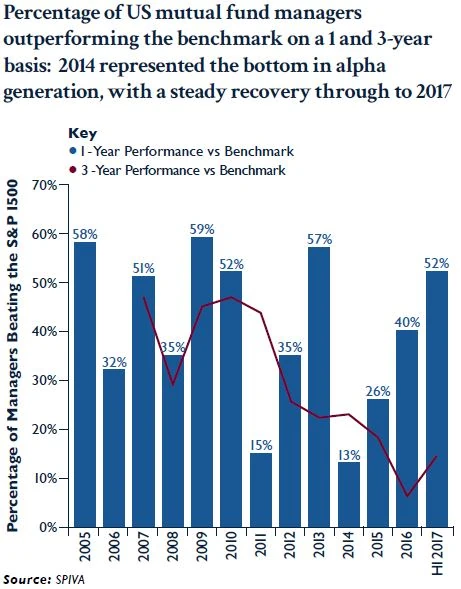
What has driven these changes in manager out-performance? We have put together a conceptual model, based on certain observable macro factors which we believe to be markers for improved alpha opportunities. These factors directly result in increased dispersion, low cross-asset correlations and higher volatility in the markets, which are all favourable for active management.
These alpha drivers and their first order effects factors are defined in Exhibit 4 and 5.
Exhibit 4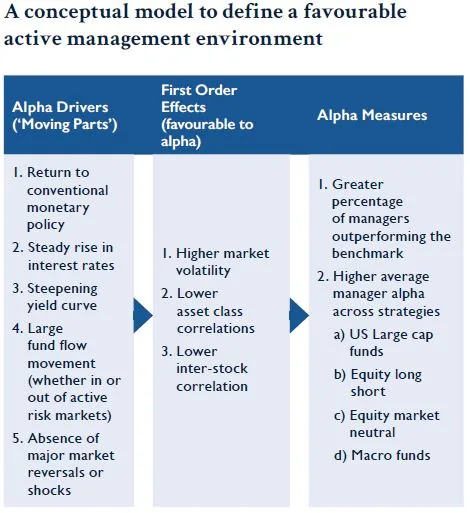
Exhibit 5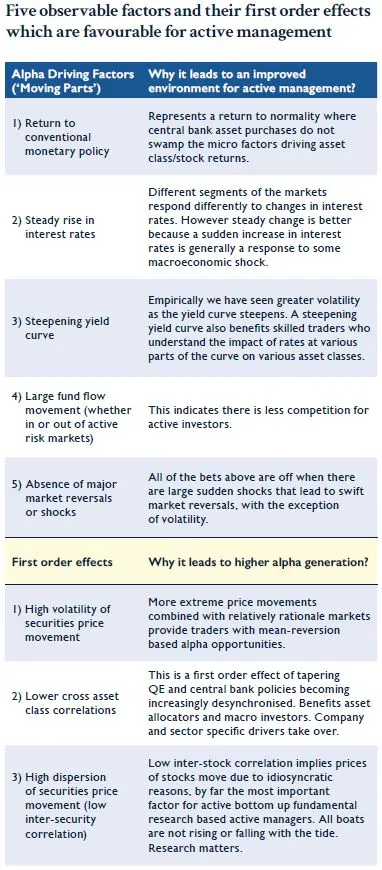
An example of first order impact would be looking at rising interest rates and falling inter-stock correlations, as shown in Exhibit 6. This is because different sectors of the markets respond differently to changes in interest rates, and within sectors, companies react differently to higher costs of capital based on factors such as their leverage levels.
Exhibit 6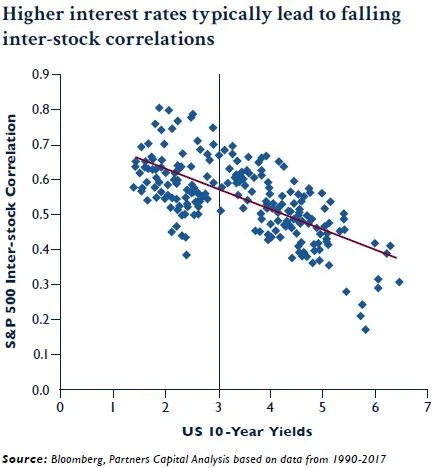
The relationship between a steepening yield curve and rising volatility is visible in Exhibit 7, although it is quite noisy because volatility will spike if there has been a market or economic shock.
Exhibit 7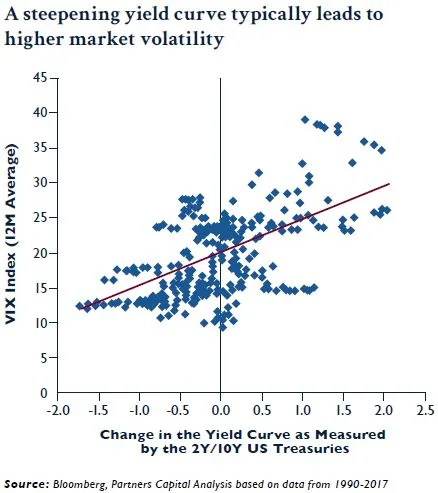
Having seen the impact of some of these factors on dispersion and volatility, we now look at their relationship with active management alpha. Exhibit 8 maps the percentage of active equity managers outperforming the S&P 1500 every year as well as their average level of out-performance, against inter stock correlation and net new assets into active managers. While the linkages to stock correlations and inflows tend to be quite clear in most years, market shock years such as 2001 and 2007-08 are exceptions where macro events swamp any stock specific information that active management relies on.
Exhibit 8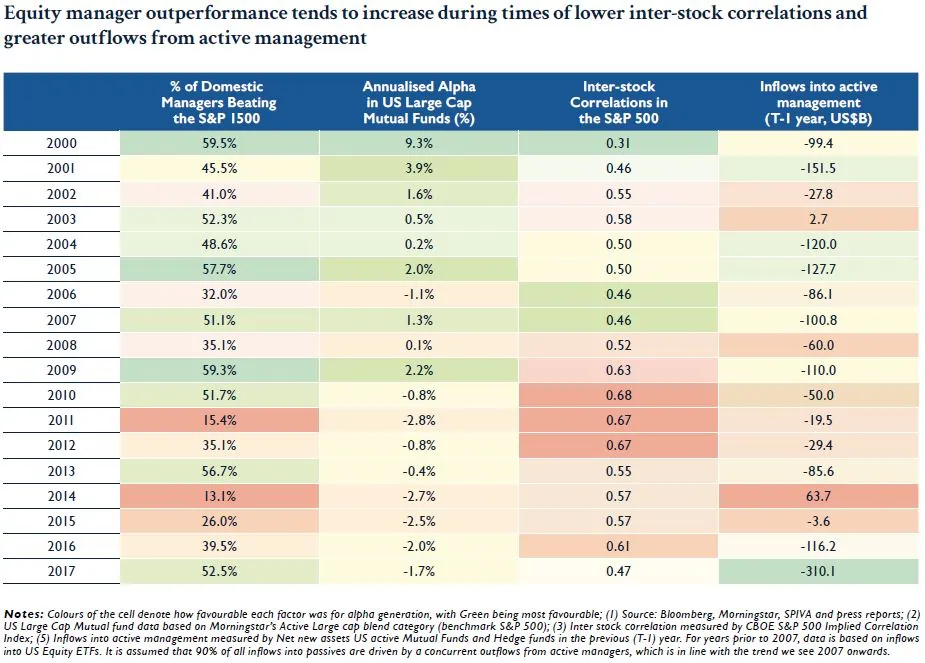
Similarly for non-equity related absolute return strategies, such as fixed income arbitrage, we see that they benefit from rising rates across the yield curve as shown in Exhibit 9.
Exhibit 9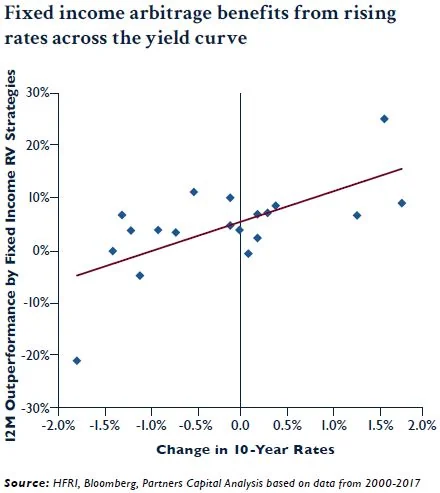
So what does this analysis bode for 2018 and beyond? We expect interest rates to rise over the course of the next couple of years, accompanied by a normalisation of monetary policy across the US. As global central bank policies become increasingly desynchronised (e.g., the Federal Reserve unwinding its monetary easing, while stimulus continues from the Bank of Japan and the ECB), linkages across asset classes, regions and stocks are giving way to more asset class and sector specific drivers. We are already seeing the impact of this with an increase in volatility and falling inter-stock and cross asset class correlations (Exhibits 10-12).
Exhibit 10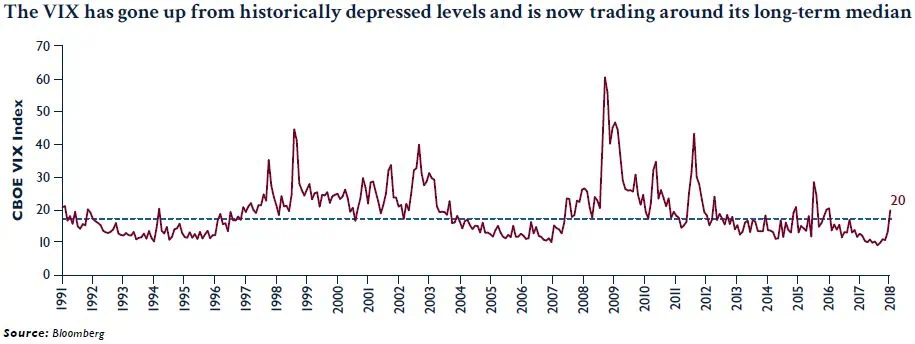
Exhibit 11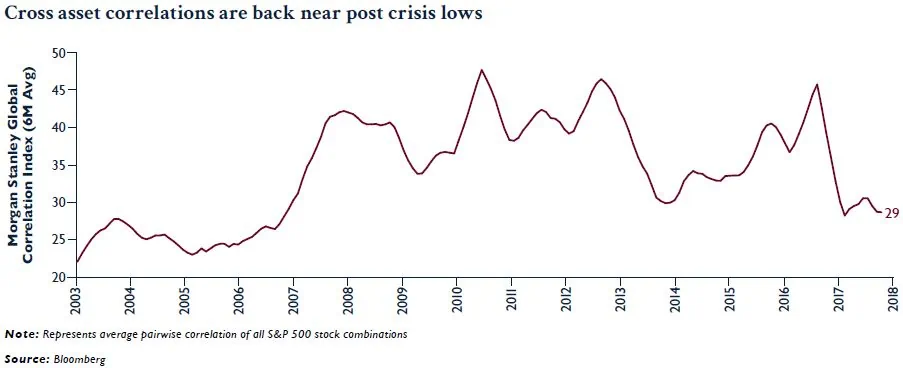
Exhibit 12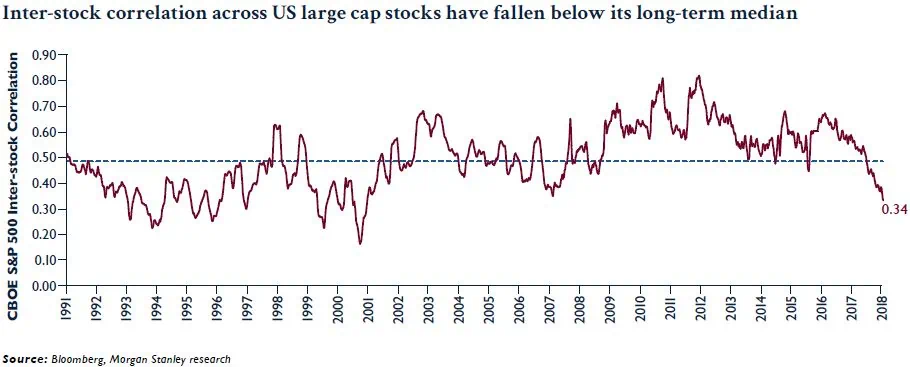
At the same time investors continue to allocate more capital to passive funds at the expense of active management as shown in Exhibit 13, something we expect to continue due to the increasing fee pressures in the asset management industry. In addition, our experience suggests that an environment of higher volatility across asset classes should provide a favourable backdrop for other absolute return strategies such as macro trading.
Exhibit 13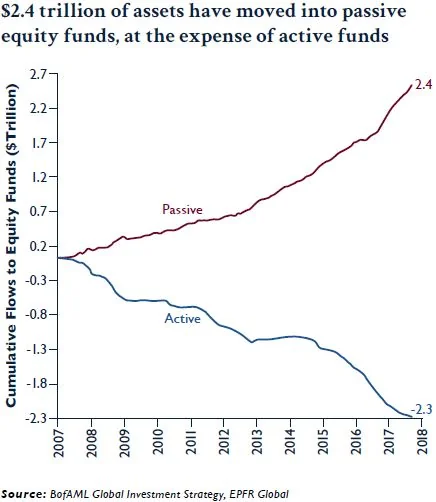
Therefore, while there are geopolitical risks on the horizon which could effectively swamp these factors, on balance we are optimistic about active management in 2018. A summary of our 2018 forecasts for each factor is detailed in Exhibit 14.
Exhibit 14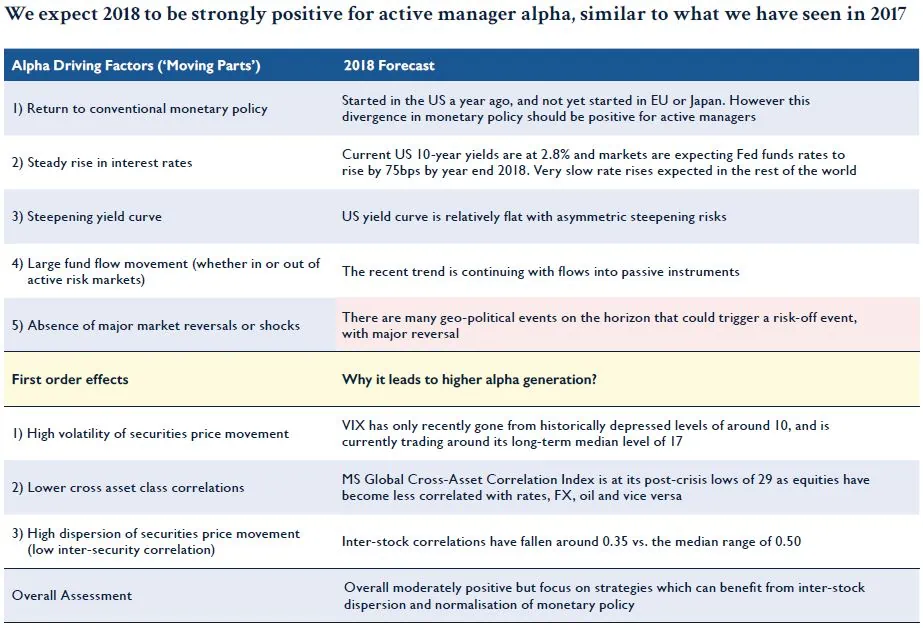
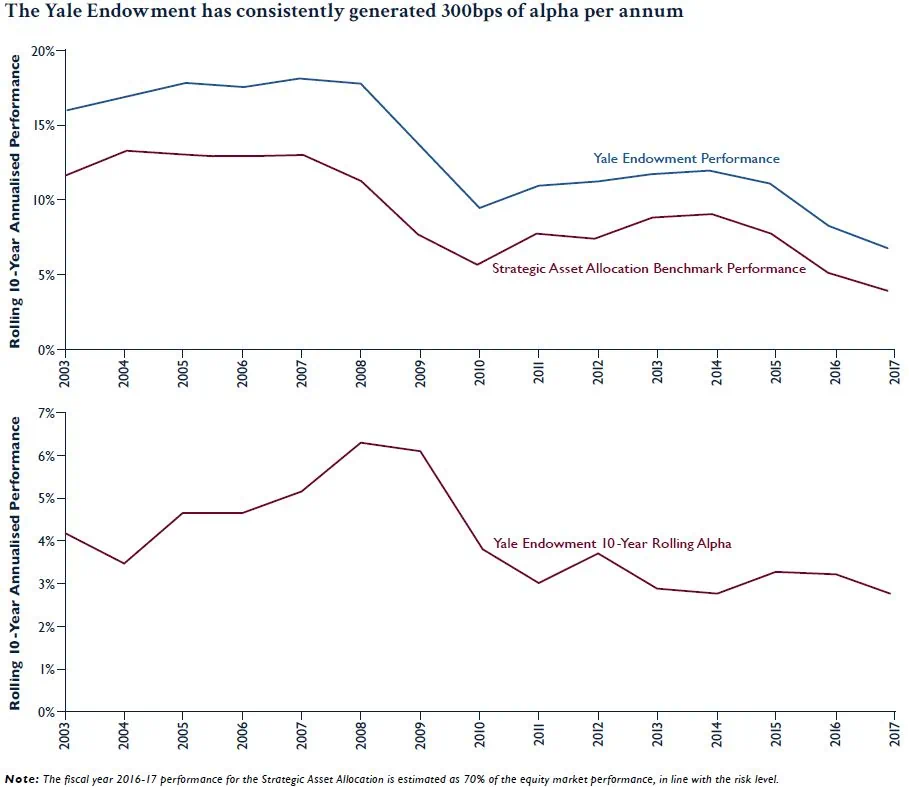
We continue to believe that holding a portfolio of the highest quality managers who can ride through cycles of low and high alpha generation achieves the best results over the long-run. This is evident from the performance of investors such as the Yale Endowment which has consistently generated 300bps of alpha per annum over its history (Exhibit 15). Therefore we remain committed to replicating this performance by accessing rare, persistent alpha generating managers across the asset classes where active management thrives.
Exhibit 15